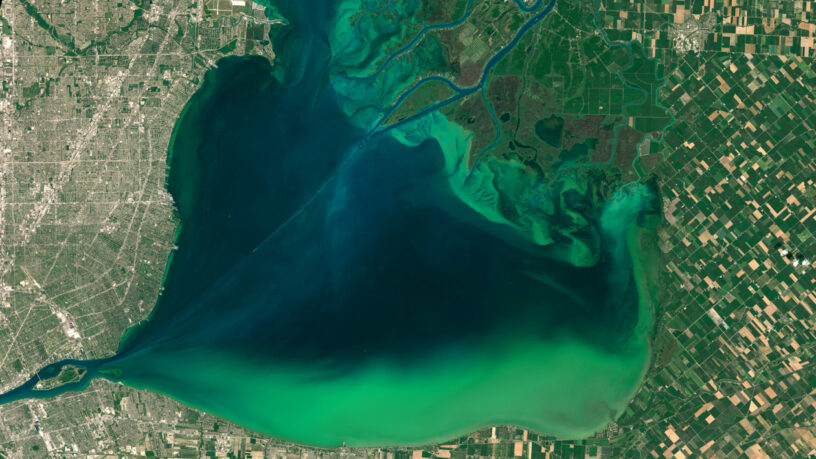
The agricultural nitrogen (N) use has exceeded the safe planetary boundary, but regional variability in nitrogen pollution and its losses were not accounted. This compound is naturally available in the soil for plant growth through biological fixation by leguminous. In food agriculture, large amounts of reactive N are added to the soil by fertilization to increase production. However, most of these inputs end up in the environment creating “dead zones in coastal waters, harmful algal blooms, terrestrial and aquatic biodiversity loss, nitrate contamination of drinking water, air pollution, stratospheric ozone depletion and climate change” (Schulte-Uebbing et al., 2022).
Sustainable Development Goals have been created proposing that intentional N fixation is one of the control variables to monitor the transgression of planetary boundaries. Nonetheless, quantifying the planetary N boundary has shown limitations such as: defining limits for ‘intentional human N fixation’ and not accounting for regional N losses differences, requiring assumptions on the N use efficiency (NUE), focusing on agriculture and not considering N pollutions from other sources, considering only reductions required and ignoring possibilities for increasing N inputs where thresholds allow, not estimating boundaries for all N-related impacts simultaneously, and not considering differences between agricultural systems N levels, pollution and productivity.
Producing enough food without exceeding regional and planetary nitrogen boundaries requires extensive and optimal use of this compound and agricultural land reducing non-agricultural nitrogen use and its losses. It is necessary to account for the heterogeneity of agricultural systems, non-agricultural nitrogen losses and environmental vulnerabilities. However, having a limited understanding of nitrogen pollution numbers creates a false situation that impedes approaches to solving the nitrogen crisis. By giving a better estimate of global and regional boundaries of agricultural nitrogen pollution and more accurate numbers for the actual concentration of N in world lands, the article shows both areas of overuse and underuse of N.
Given current limitations when estimating N boundaries, the article presents a different “approach for estimating regional and planetary boundaries for agricultural N surplus and N inputs” (Schulte-Uebbing et al., 2022). N surplus is total N input minus N removal (from crop and grass). It represents the total of all unused N, closely representing the cause of N pollution and being the leading indicator to define a planetary N boundary. The article also presents boundaries for total agricultural N inputs for fertilizing, biological fixation, ‘recycled’ inputs from manure, and deposition under current regional NUEs. Regional and planetary N boundaries are based on spatial thresholds: N deposition rates avoiding biodiversity loss, N concentrations in surface water limiting eutrophication and N concentrations in groundwater to meet World Health Organization (WHO) drinking water standards. Nitrogen contribution to climate change, ozone depletion, and health impacts from emission was not considered, but the effects of reaching their threshold are quantified.
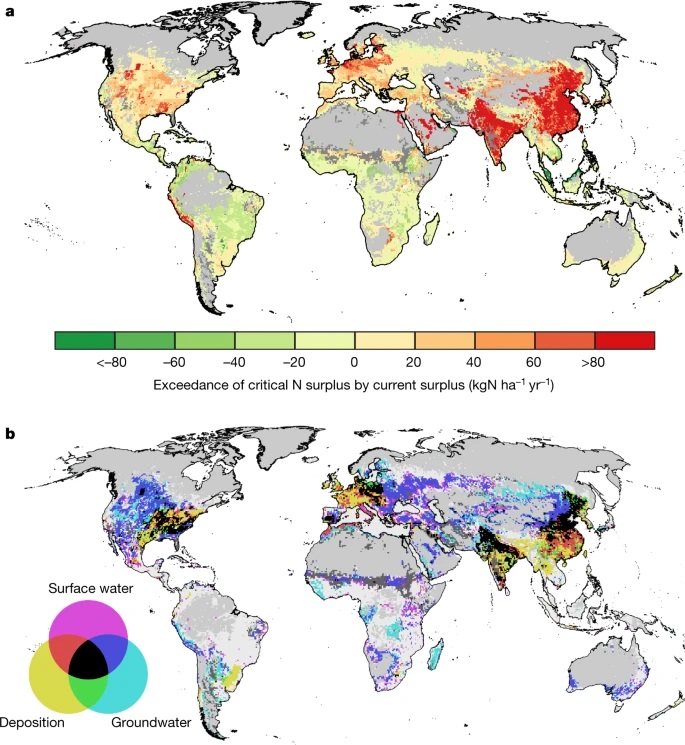
To calculate critical agricultural N inputs and surpluses and arrive at regional and global N boundaries, article scientists used a mathematical and bioinformatic (Phyton modelling code) approach. The tool called Integrated Model to Assess the Global Environment (IMAGE) Global Nutrient Model (GNM) “is a global distribution and spatially explicit model that uses hydrology to analyze nitrogen and phosphorus delivery to surface water transport and in-stream retention in rivers, lakes, wetlands and reservoirs” (Beusen et al., 2015). These IMAGE-GNM analyses and calculations were performed to estimate the spatial thresholds aforementioned (N deposition rates, N concentrations in surface water, N concentrations in groundwater) and calculate the aggregated global surplus boundary. In conclusion, the aggregated global surplus boundary for all thresholds is 43 megatons of nitrogen per year, and the current nitrogen surplus (2010) was 119 megatons of nitrogen per year. If the nitrogen surplus were increased in areas where environmental thresholds are not exceeded, the planetary nitrogen boundary would lift to 57 megatons of nitrogen per year. Regionally, it is observed that if the threshold for N load in the surface water is exceeded, the threshold for groundwater is also exceeded, and vice-versa. Other water-related thresholds are not achieved in areas where the N deposition threshold is achieved. Moreover, 66% of the global agricultural land area has exceeded at least one of the thresholds.
This experiment gives a better understanding of nitrogen distribution in the world compared with previous estimates. Furthermore, it shows areas that could be explored (without exceeding the nitrogen thresholds) to maximize food production while respecting global nitrogen boundaries (Figure 1). Also, although the N boundaries presented by the paper represent thresholds for the current agricultural system, the approach allows a dynamic assessment under changing conditions and practices.

Figure 1: Global exceedance of nitrogen thresholds. a, Reductions of agricultural N surplus required to respect all three environmental thresholds simultaneously. Positive values (red) indicate needed reductions and negative values (green) indicate possible increases within thresholds. b, Type of N-related threshold (critical N deposition, critical N load to surface water and critical N leaching to groundwater) that has been exceeded. The colours indicate exceedance of none (white), one, two or all three thresholds (see legend). Areas with no agricultural land are light grey and areas where critical surplus could not be calculated are dark grey (Schulte-Uebbing et al., 2022).
Resources:
Schulte-Uebbing, L. F., Beusen, A. H. W., Bouwman, A. F., & de Vries, W. (2022). From planetary to regional boundaries for agricultural nitrogen pollution. Nature, 610(7932), Art. 7932. https://doi.org/10.1038/s41586-022-05158-2
Beusen, A. H. W., Van Beek, L. P. H., Bouwman, A. F., Mogollón, J. M., & Middelburg, J. J. (2015). Coupling global models for hydrology and nutrient loading to simulate nitrogen and phosphorus retention in surface water – description of IMAGE–GNM and analysis of performance. Geoscientific Model Development, 8(12), 4045–4067. https://doi.org/10.5194/gmd-8-4045-2015


